Cradlepoint | NetCloud Manager | UX/UI Design
Speed Test for installers and remote troubleshooting
Re-architecting Speed Test so installers and support can see connection type and performance straight away, run tests on demand, and keep results for history.
Role
Interaction Designer III: UI/UX design
Timeline
Jan 2019 – Nov 2024
Tools
icons designed for NetCloud Manager
Team
Product managers, engineering, marketing, and
stakeholders
Overview
The situation
Quick performance assessments are essential during installation, post-installation, and troubleshooting of wireless WAN connections.
Installers need immediate insight into connection types (5G, 4G, or 3G), especially for 5G setups requiring extra steps. An intuitive, visually appealing interface is crucial for ease of use, efficient decision-making, and streamlined troubleshooting.
Proposal
Update and re-architect Speed Test to address known limitations to both back-end and front-end. To increase functionality and value for more accurate results that are stored for both historical customer visibility and leverage for Cradlepoint AI and ML to provide business intelligent insights.
Approach
Process
I developed a solution within Cradlepoint's wireless WAN platform to address the need for streamlined performance monitoring and troubleshooting.
1
Immediate insight
Designed intuitive user interfaces that offer immediate network performance insights and connection-type identification (5G, 4G, or 3G).
2
On-demand testing
Incorporated on-demand Speed Test functionality to enhance remote troubleshooting.
3
Scheduling and history
Built a scheduling system for storing and analyzing Speed Test results in real time and historically.
4
API integration
Leveraged APIs to integrate these features into a cohesive, user-friendly experience.
Before
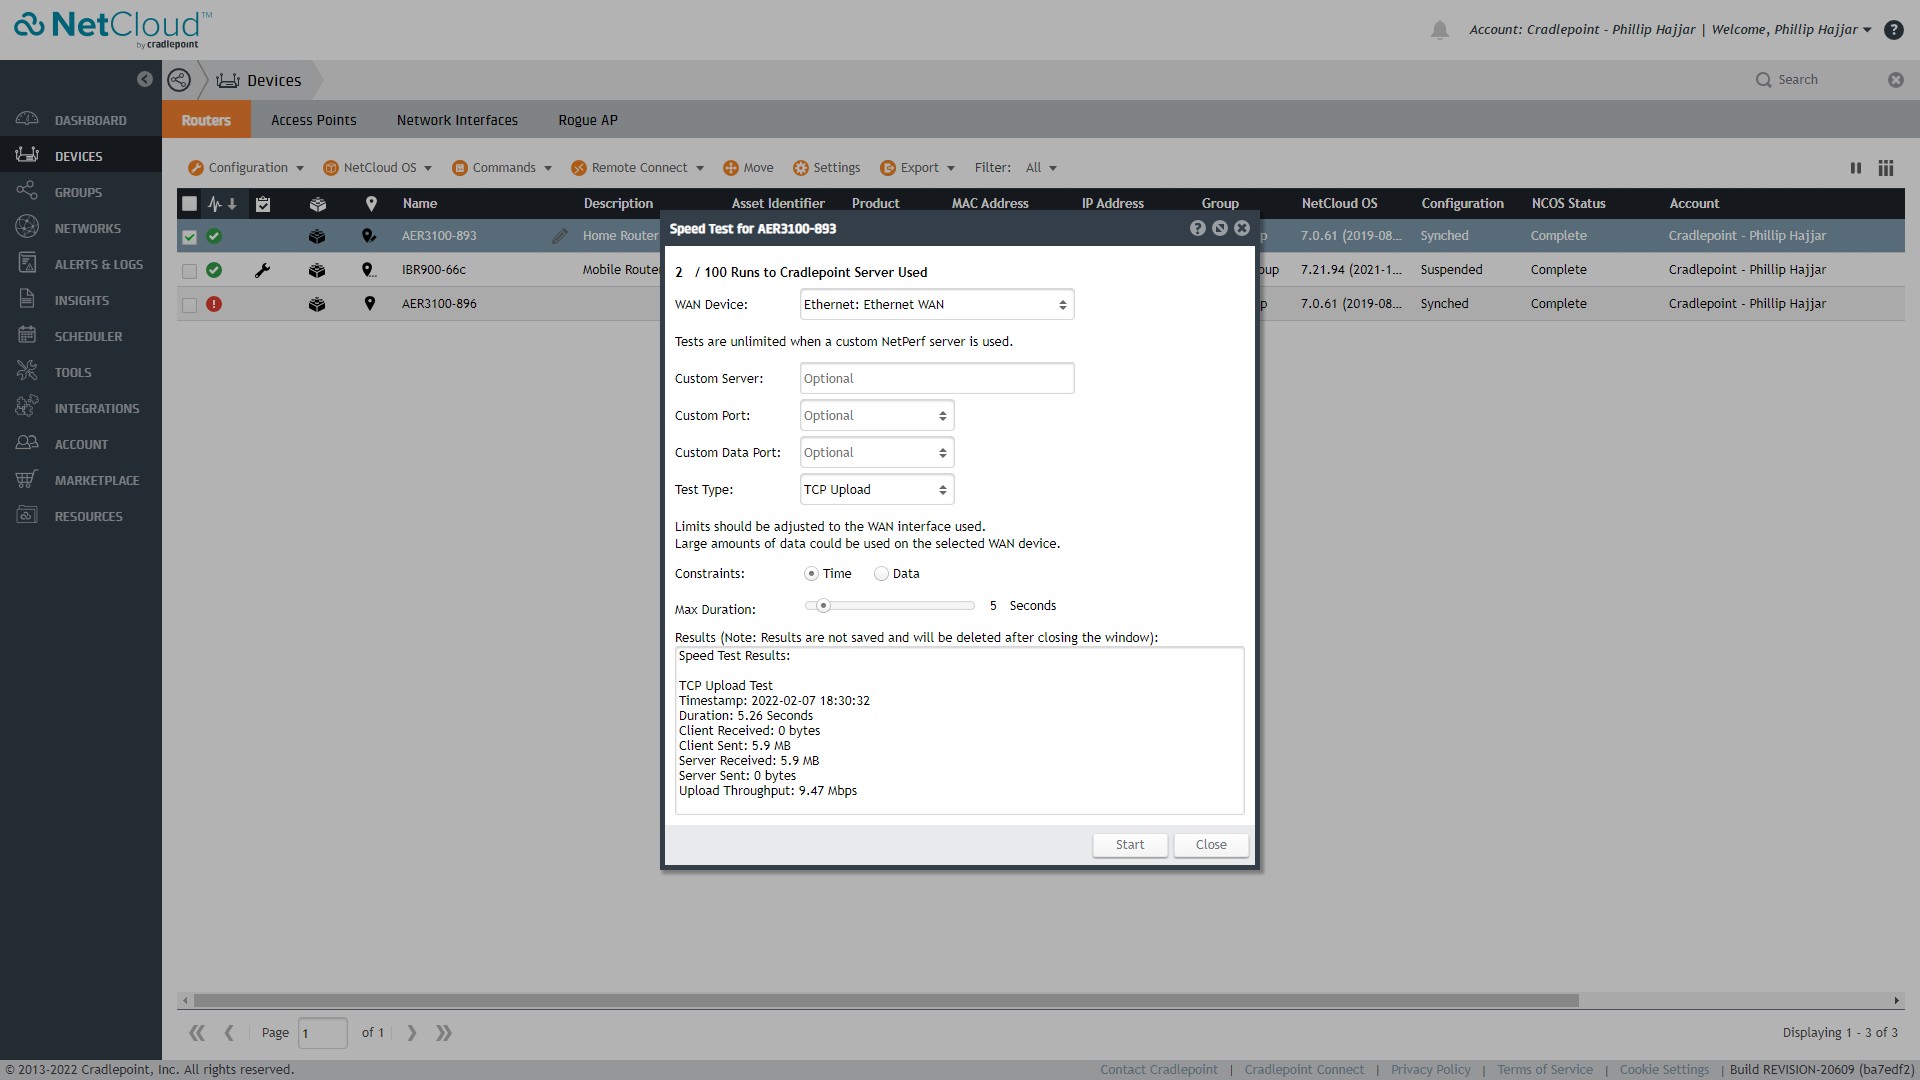
Speed Test opens as a dialog over the Devices table: WAN device, test type (TCP Upload), time or data limit, and a text result with duration, data sent, and upload throughput.
After
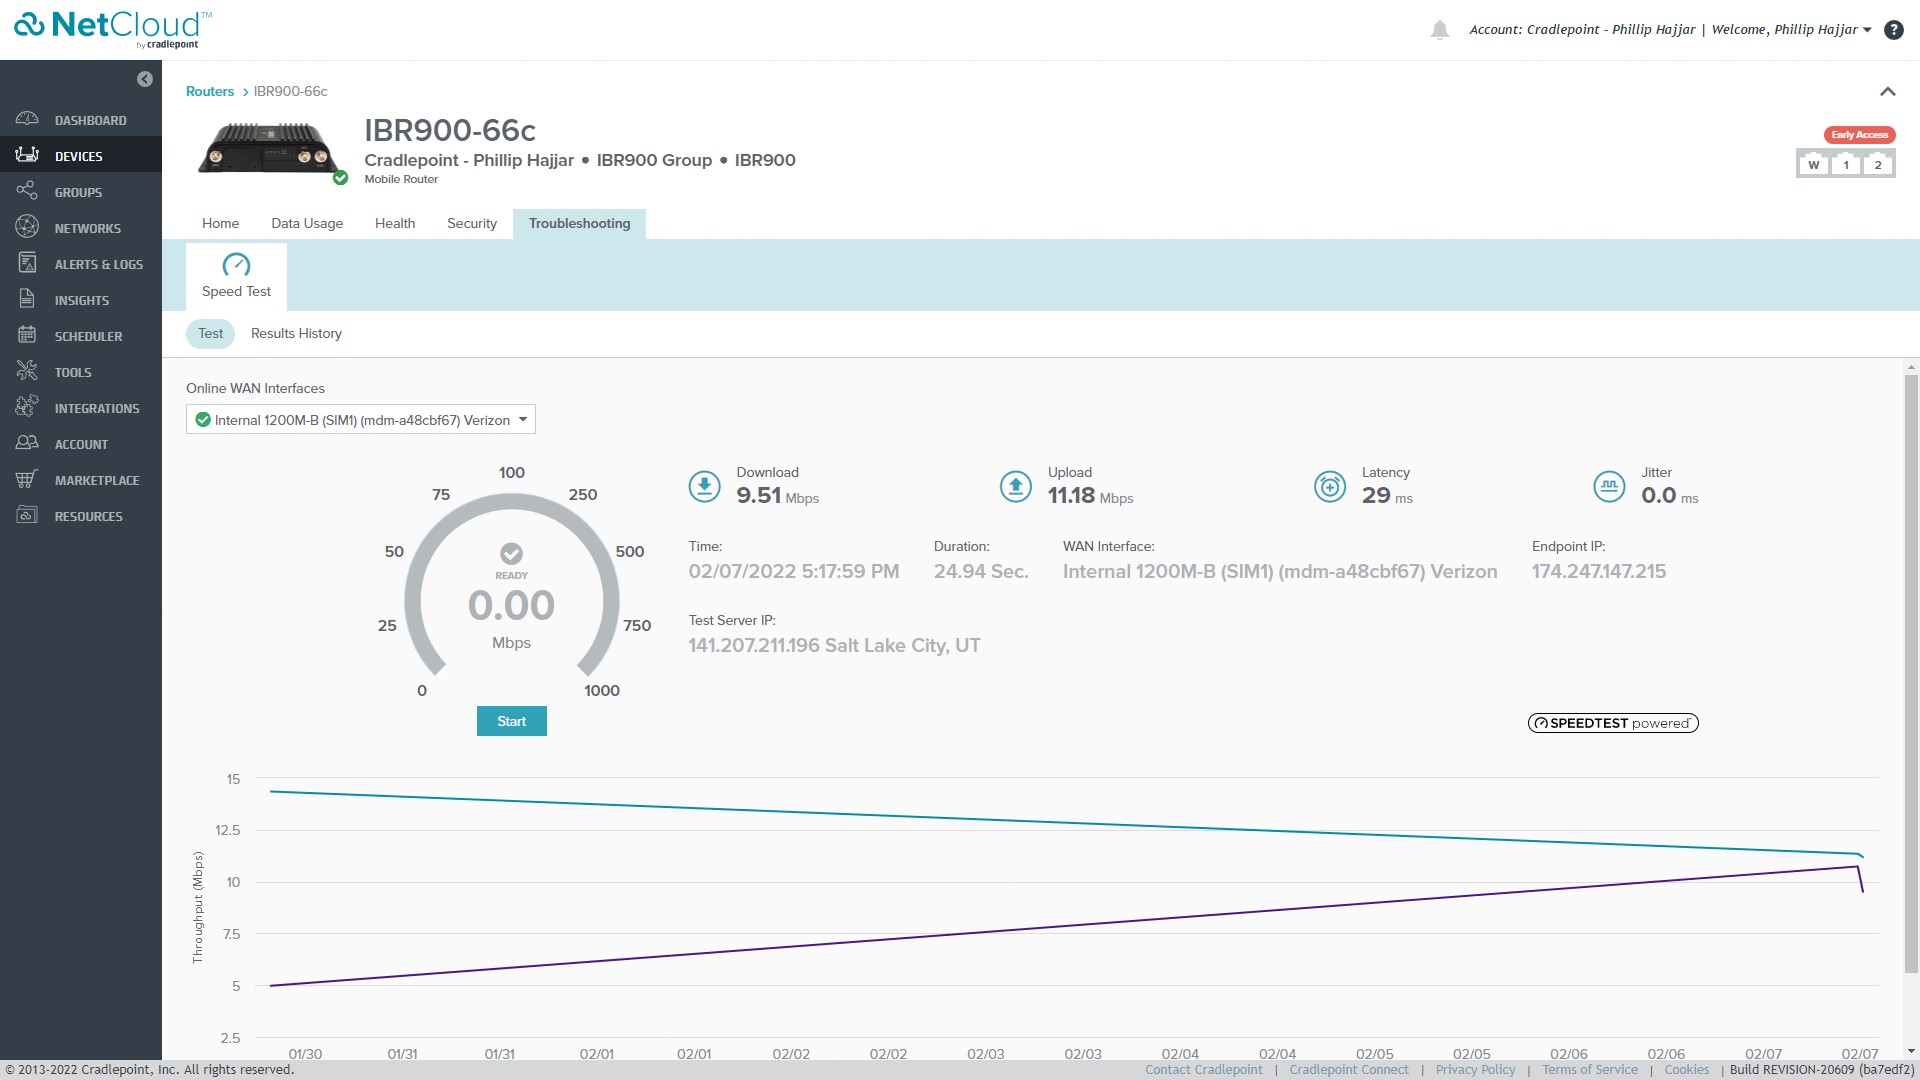
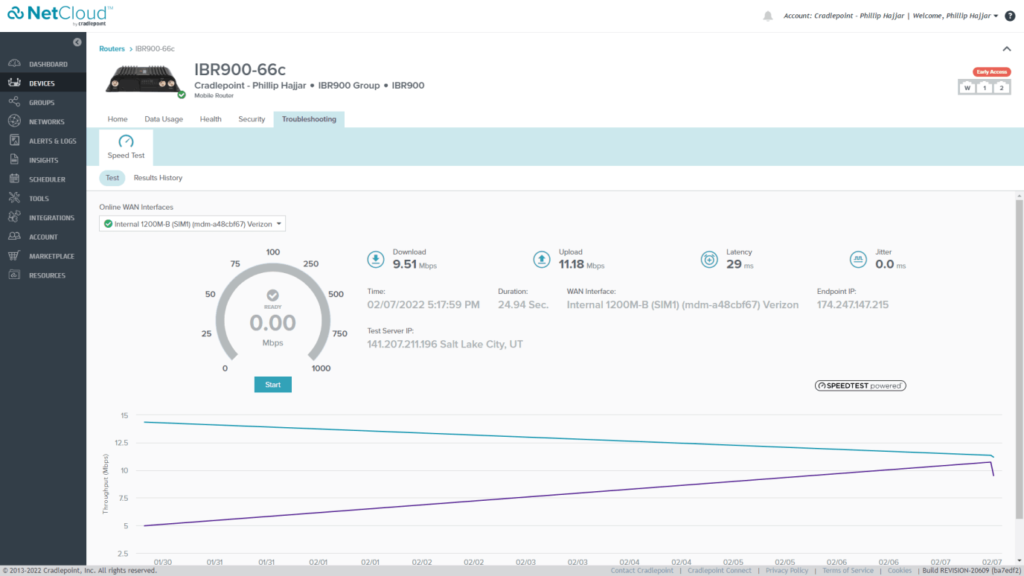
Speed Test as part of a device's Troubleshooting tab: a gauge with a Start button, Download, Upload, Latency, and Jitter readouts, test details, a Results History tab, and a Throughput (Mbps) graph over time.
Outcome
Impact
What changed
The live page states the value as: simplified installation, improved performance assessment, and supported accurate troubleshooting, delivering value to customers and stakeholders. No metrics are given.
Next project
HP: Express Decision Portal
Redesigning a managed print services portal from dark gray and black to blue and white.
Let's talk
Meridian, ID
designed@philliphajjar.com
Website Designed by Phillip Hajjar